Justin Meritt
Founder & CEO

The “Cube”, “OLAP”, “relational”, “cloud”, “EPM”, “CPM”, “FPM”, “AI”, “Agentic”, “On Prem”...
What do all these terms have in common?
They were created for marketing purposes and really serve limited to no purpose in actually describing a technology or a capability set.
Let’s take “cloud” as an example.
What is “cloud”?
Would you be surprised to know that it simply refers to the utilization of remote processing over the processing available on the machine you’re working on? Usually qualified by the remote processing happening on a network outside of your local network.
How about “OLAP”?
It might surprise you to learn that it simply means the ability to send calculations off to be calculated somewhere not on your local machine.
I could go through each term, but I think you get the point. Most terms we associate with technology & specifically technology for business, are just marketing jargon.
Why?
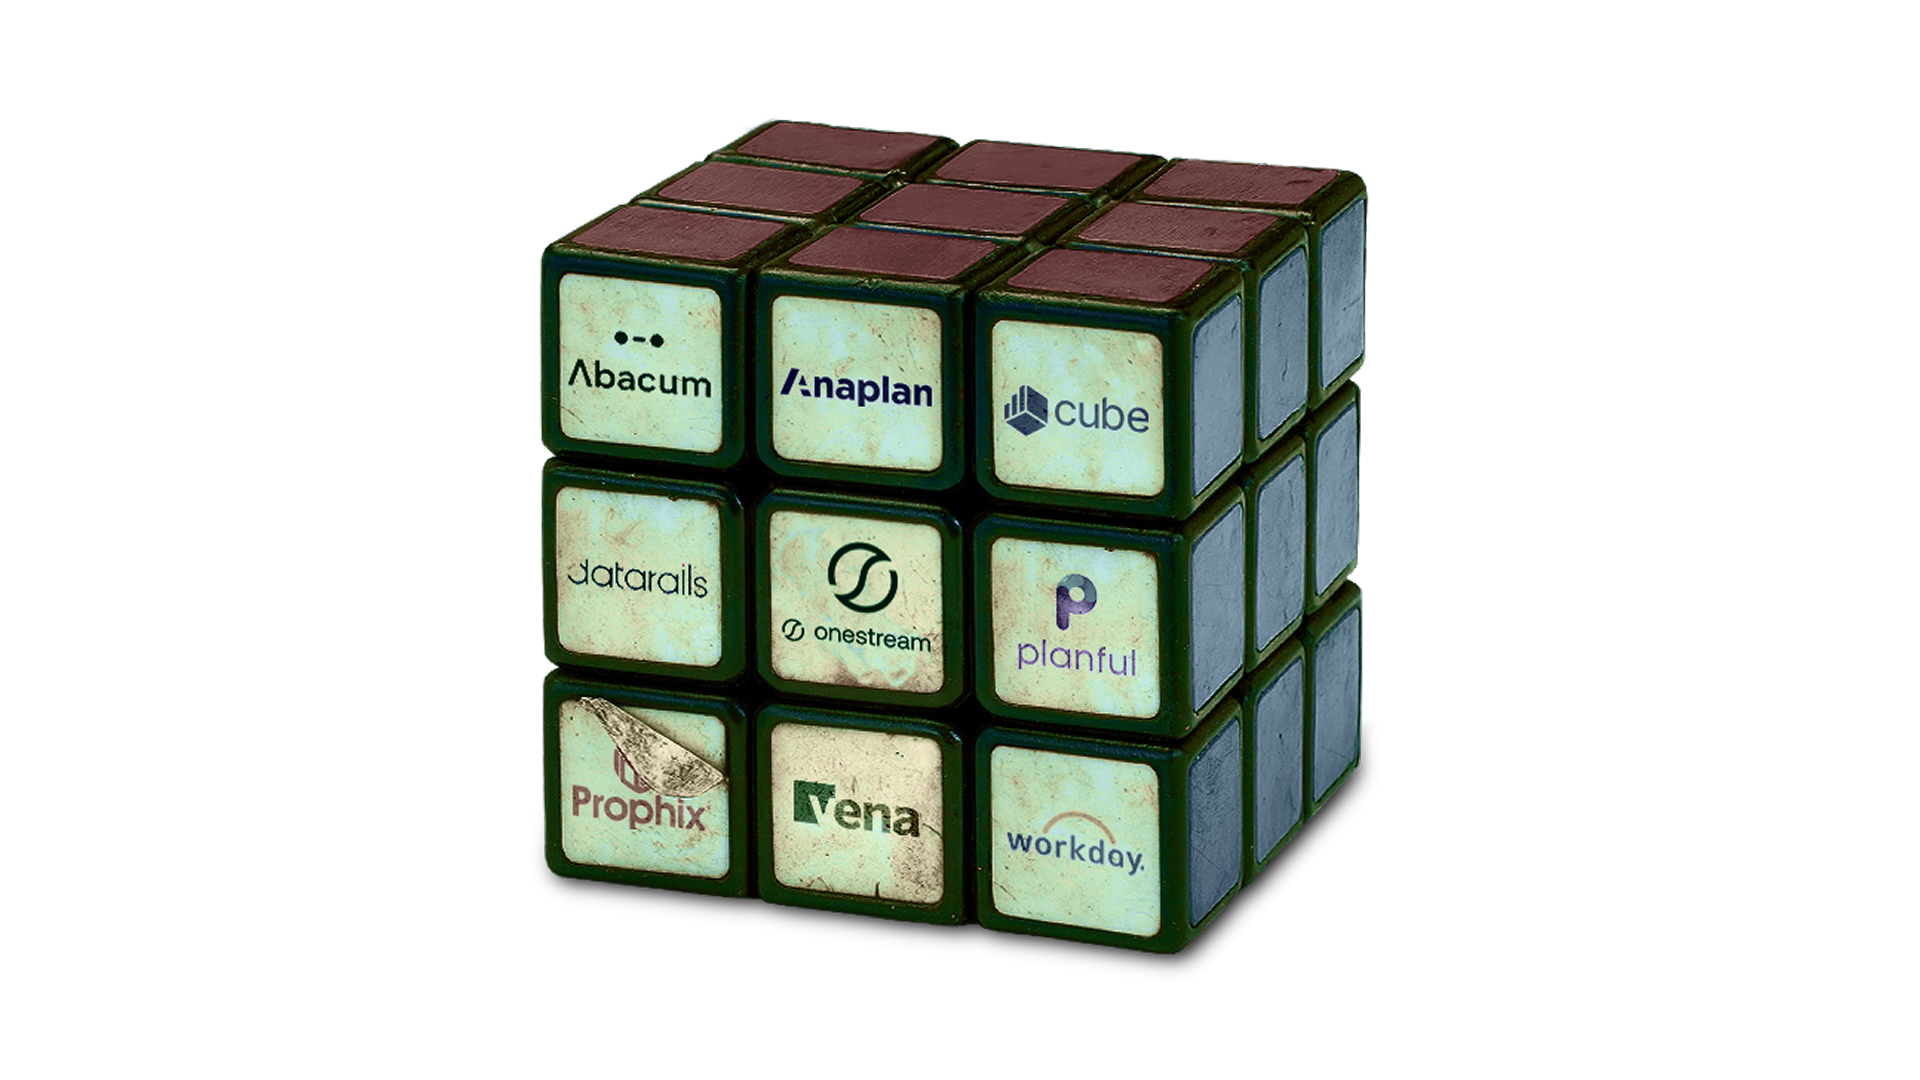
Because in a crowded space with extremely low barriers to entry & in the neighborhood of 20 to 40 new competitors a year, how else do you differentiate?
Without marketing, terms like “hypercube” and “cloud native” and “code free” and “in-memory” and even “cube” wouldn’t be in our vernacular.
So let’s put the marketing terms aside for a moment and focus on what all this really boils down to: Math.
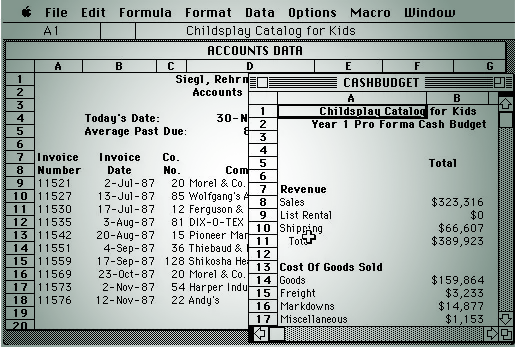
When businesses moved from ledger paper to electronic ledgers, thanks to Peachtree, there needed to be a way to store this information coming from the entries in the double entry accounting system. The data on a ledger looks something like this:

Looks familiar doesn’t it?
Now, we need a way to store this type of data for the ease of mathematical operations.
Behind Peachtree was all the data you needed to analyze your business - but how do you work with it?
The natural translation of an application database in the late 1970’s was to expose this data in a format called “R1C1” which doesn’t have a great marketing ring to it, thus the “spreadsheet” was born.
While we are now some 40 years later, the spreadsheet idea remains. Representing data in a grid comprised of rows of data that are organized by columns of attributes for that data is more prevalent than ever, but it is also infinitely more complex.
The challenge in the early 1980’s was the volume of data in the new electronic ledgers was far outpacing the compute power of the personal computer. Leading to real challenges like:
“How can we analyze all this data?”
“Our spreadsheets keep crashing, what do we do?”
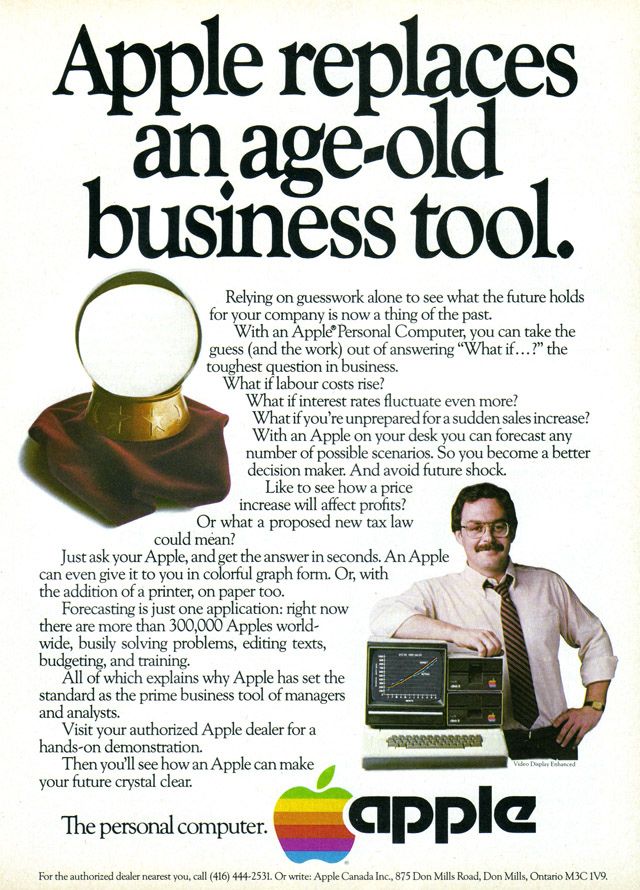
Excel was first released in 1985 exclusively on the Mac (yes you read that right) to attempt to solve these exact problems. A spreadsheet with intelligence. How? With a massive leap forward in calculation efficiency thanks to a mathematical concept as old as math itself; the array.
The array took the matrix mathematics the spreadsheet was already so good at to an entirely new level. Allowing users to reference names of attributes and ranges of data instead of specific rows and columns for the first time. This greatly reduced the calculation load on the computer by limiting the scope to just the values that will produce an output. It also created an entirely new opportunity for marketing.
So what is the cube?
It’s the mathematical intermediary between a set of data (think transactions) and the output of the array calculations.
To overcome the computing shortcomings of the early 1980’s some, now very well known, technologies came to market featuring an all new way to organize and summarize your data into cubes for incredibly fast analytics and calculation outputs.
This relied on creating a standard set of business dimensions that the detailed transaction data could be summarized into for further analysis. There were some compromises though, to keep the data sets manageable both from a size and a sparsity perspective…
Transaction Date became Month & Year.
Properties like customer, vendor, product were dropped and replaced by summary ledger accounts.
While this may be “good enough” for finance and accounting teams, this left all operational teams in the lurch. Until later in the 1980’s when marketing struck again.
A small group of engineers had a great idea - what if instead of 1 cube we could have many cubes?!
It sounds great, but the challenges remain. These cubes are highly structured, must have rigid dimension definitions, and are plagued by performance issues when the cubes and their calculations are interdependent.
It’s here that time stood still for nearly 40 years. Many tried to solve the issues with more horsepower from cloud computing, virtual dimensions, calculations handled by the memory vs the CPU and only outputs posted via stored procedures. And most recently even using the GPU as a supplement.
Which all fail to address the root cause.
All these attempts ran into various speed bumps, roadblocks, and ultimately left the consumer with no option but to turn to their old friend and the gold standard since PeachTree created the electronic ledger - export data to Excel and work with it there (and ok sure there’s Google Sheets too).
But wait!
How is this possible?
Because all the while others were distracted trying to invent new and better ways to cube, the spreadsheet was growing in power thanks to leaps forward in CPUs, RAM, GPUs, HDDs, and even that all illusive cloud.
Of course, we all know far too well where this story is headed. Right back to where we started.
If we step back and take an outside-in approach to the problem we arrive at an interesting question:
Why must data be EITHER relational OR dimensional? Isn’t it both?
How can an application provide an approach that allows for handling data the way it needs to be handled based on the type of data and the desired outputs from that data?
How can we break free of the spreadsheet, while also recognizing that at its core data is well represented in grids?
How can we create an experience that allows the business to focus on the business and not on versioning scenarios, creating cubes, building templates, or rolling models forward (spreadsheets or otherwise)?
The first truly infinitely flexible multi-dimensional data platform. Built not on four decade only technology but re-imagined from the ground up with consideration of the legacy data challenges, the critical user adoption issues, and fully AI ready to handle the future with ease.

So no, the cube isn’t dead.
And no, the spreadsheet isn’t dead.
It just finally got the reinvention it's been waiting 40 years to get.
Want to see how? We are happy to show you.
Vive la revolution.
Powered by Pigment.
.png)
OLAP (Online Analytical Processing) is simply the ability to send calculations off to be processed somewhere other than your local machine—typically on a remote server or database. Despite the complex marketing terminology, OLAP fundamentally refers to organizing data into structured "cubes" that summarize detailed transaction information into standard business dimensions like time periods, accounts, and departments. While this approach was revolutionary in the 1980s for handling large datasets, traditional OLAP systems are highly structured, require rigid dimension definitions, and often suffer from performance issues when cubes become interdependent. The technology helped move beyond basic spreadsheets but comes with significant limitations in flexibility and scalability that modern businesses require.
Spreadsheets crash because they weren't designed to handle the volume and complexity of modern business data. While Excel and Google Sheets have evolved significantly since the 1980s, they still rely on fundamental architecture that becomes overwhelmed when processing large datasets, complex calculations, or multiple interdependent formulas. Common crash triggers include: working with datasets over 100,000 rows, running complex array formulas across large ranges, insufficient RAM for data processing, circular references in calculations, and attempting real-time collaboration on data-heavy files. Additionally, spreadsheets store everything in memory, so when your data exceeds your computer's available RAM, performance degrades rapidly and crashes become inevitable. This is why businesses often find themselves exporting data from enterprise systems back to Excel—only to hit the same computational limitations that drove them to seek software solutions in the first place.
Pigment is the first truly infinitely flexible multi-dimensional data platform, reimagined from the ground up rather than built on decades-old technology. Unlike traditional planning software that forces you to choose between relational OR dimensional data structures, Pigment handles data the way it actually exists—as both relational and dimensional simultaneously. This eliminates the rigid cube structures and performance limitations that plague legacy OLAP systems. Pigment combines the familiar grid-based interface that users love about spreadsheets with enterprise-grade calculation engines, real-time collaboration, and AI-powered insights. The platform is fully cloud-native and AI-ready, allowing users to focus on business strategy rather than wrestling with technical limitations like versioning scenarios, building cubes, or managing templates. Most importantly, Pigment delivers the user experience of Excel with the power and scalability needed for modern enterprise planning—finally bridging the 40-year gap between usability and capability.
TwinSix helps finance teams break free from Excel limitations and legacy planning systems through specialized Pigment implementations and ongoing optimization. As Pigment's premier North American partner, we combine deep finance expertise with cutting-edge technology to deliver rapid, business-focused transformations that actually work.
Finance-First.
Tech-Enabled.
Results-Driven.
The “Cube”, “OLAP”, “relational”, “cloud”, “EPM”, “CPM”, “FPM”, “AI”, “Agentic”, “On Prem”...
What do all these terms have in common?
They were created for marketing purposes and really serve limited to no purpose in actually describing a technology or a capability set.
Let’s take “cloud” as an example.
What is “cloud”?
Would you be surprised to know that it simply refers to the utilization of remote processing over the processing available on the machine you’re working on? Usually qualified by the remote processing happening on a network outside of your local network.
How about “OLAP”?
It might surprise you to learn that it simply means the ability to send calculations off to be calculated somewhere not on your local machine.
I could go through each term, but I think you get the point. Most terms we associate with technology & specifically technology for business, are just marketing jargon.
Why?
Because in a crowded space with extremely low barriers to entry & in the neighborhood of 20 to 40 new competitors a year, how else do you differentiate?
Without marketing, terms like “hypercube” and “cloud native” and “code free” and “in-memory” and even “cube” wouldn’t be in our vernacular.
So let’s put the marketing terms aside for a moment and focus on what all this really boils down to: Math.
When businesses moved from ledger paper to electronic ledgers, thanks to Peachtree, there needed to be a way to store this information coming from the entries in the double entry accounting system. The data on a ledger looks something like this:
Looks familiar doesn’t it?
Now, we need a way to store this type of data for the ease of mathematical operations.
Behind Peachtree was all the data you needed to analyze your business - but how do you work with it?
The natural translation of an application database in the late 1970’s was to expose this data in a format called “R1C1” which doesn’t have a great marketing ring to it, thus the “spreadsheet” was born.
While we are now some 40 years later, the spreadsheet idea remains. Representing data in a grid comprised of rows of data that are organized by columns of attributes for that data is more prevalent than ever, but it is also infinitely more complex.
The challenge in the early 1980’s was the volume of data in the new electronic ledgers was far outpacing the compute power of the personal computer. Leading to real challenges like:
“How can we analyze all this data?”
“Our spreadsheets keep crashing, what do we do?”
Excel was first released in 1985 exclusively on the Mac (yes you read that right) to attempt to solve these exact problems. A spreadsheet with intelligence. How? With a massive leap forward in calculation efficiency thanks to a mathematical concept as old as math itself; the array.
The array took the matrix mathematics the spreadsheet was already so good at to an entirely new level. Allowing users to reference names of attributes and ranges of data instead of specific rows and columns for the first time. This greatly reduced the calculation load on the computer by limiting the scope to just the values that will produce an output. It also created an entirely new opportunity for marketing.
So what is the cube?
It’s the mathematical intermediary between a set of data (think transactions) and the output of the array calculations.
To overcome the computing shortcomings of the early 1980’s some, now very well known, technologies came to market featuring an all new way to organize and summarize your data into cubes for incredibly fast analytics and calculation outputs.
This relied on creating a standard set of business dimensions that the detailed transaction data could be summarized into for further analysis. There were some compromises though, to keep the data sets manageable both from a size and a sparsity perspective…
Transaction Date became Month & Year.
Properties like customer, vendor, product were dropped and replaced by summary ledger accounts.
While this may be “good enough” for finance and accounting teams, this left all operational teams in the lurch. Until later in the 1980’s when marketing struck again.