Planning & Reporting

For Finance Teams

Request a demo

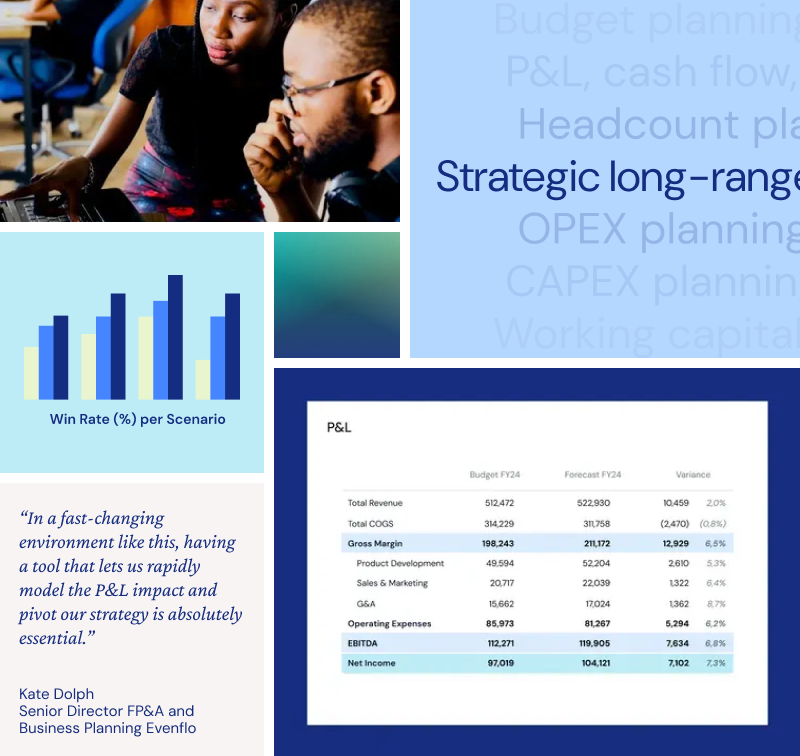
Collage featuring two people discussing work at a laptop, a bar chart titled 'Win Rate (%) per Scenario', a financial table showing budget and forecast comparisons with highlighted margins, and a quote about the importance of modeling P&L impact for strategy pivoting.

See Pigment in action

Play the 2 minute interactive demo to discover how Pigment works.

Financial Planning In pigment

1.

Integrate anything, understand everything

Build accurate plans with up-to-date and complete data which are easily integrated through native connectors, open APIs, and scheduled imports. Then use AI-powered search and reporting to understand your business performance in an instant.

Grid of software and cloud service logos including Snowflake, SAP, Workday, Salesforce, Google, and AWS Redshift on a blue background.
Two men sitting on a blue couch in a modern room, one using a laptop and the other holding a white mug.

2.

Plan how you need, not how you’re told

Pigment fits how your business operates, no matter how complex. Take advantage of a scalable engine powered by our distributed architecture, built-in collaboration and intuitive user experience to make planning work for you.

3.

Stay ready for change

Plans always change, and sometimes fast. With Pigment, change your models as your business evolves and evaluate the impact of potential decisions. Play with one-click scenarios, and test any changes before you deploy them.
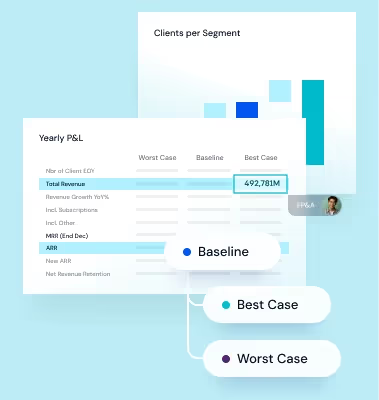

Diagram showing yearly P&L scenarios with best, baseline, and worst cases connected to a clients per segment bar chart.
Agents overview

Meet your network of intelligent agents

Pigment Agents combine deep expertise with shared intelligence. Together, they accelerate outcomes and expand what your team can achieve.
Blue cube icon with a dark circular background.

The Analyst

Proactively analyzes data, automates reporting, and spots risks and opportunities.

Data Analysis
Storytelling
Continuous Monitoring
Two overlapping reports with the title 'Revenue variance Analysis: Actuals Vs Q2 Reforecast,' showing focus on top 3 products contributing to revenue and a bar chart of customer ARR for Enterprise Product.
Pink geometric sails forming an abstract sailboat icon on a dark circular background.

The Planner

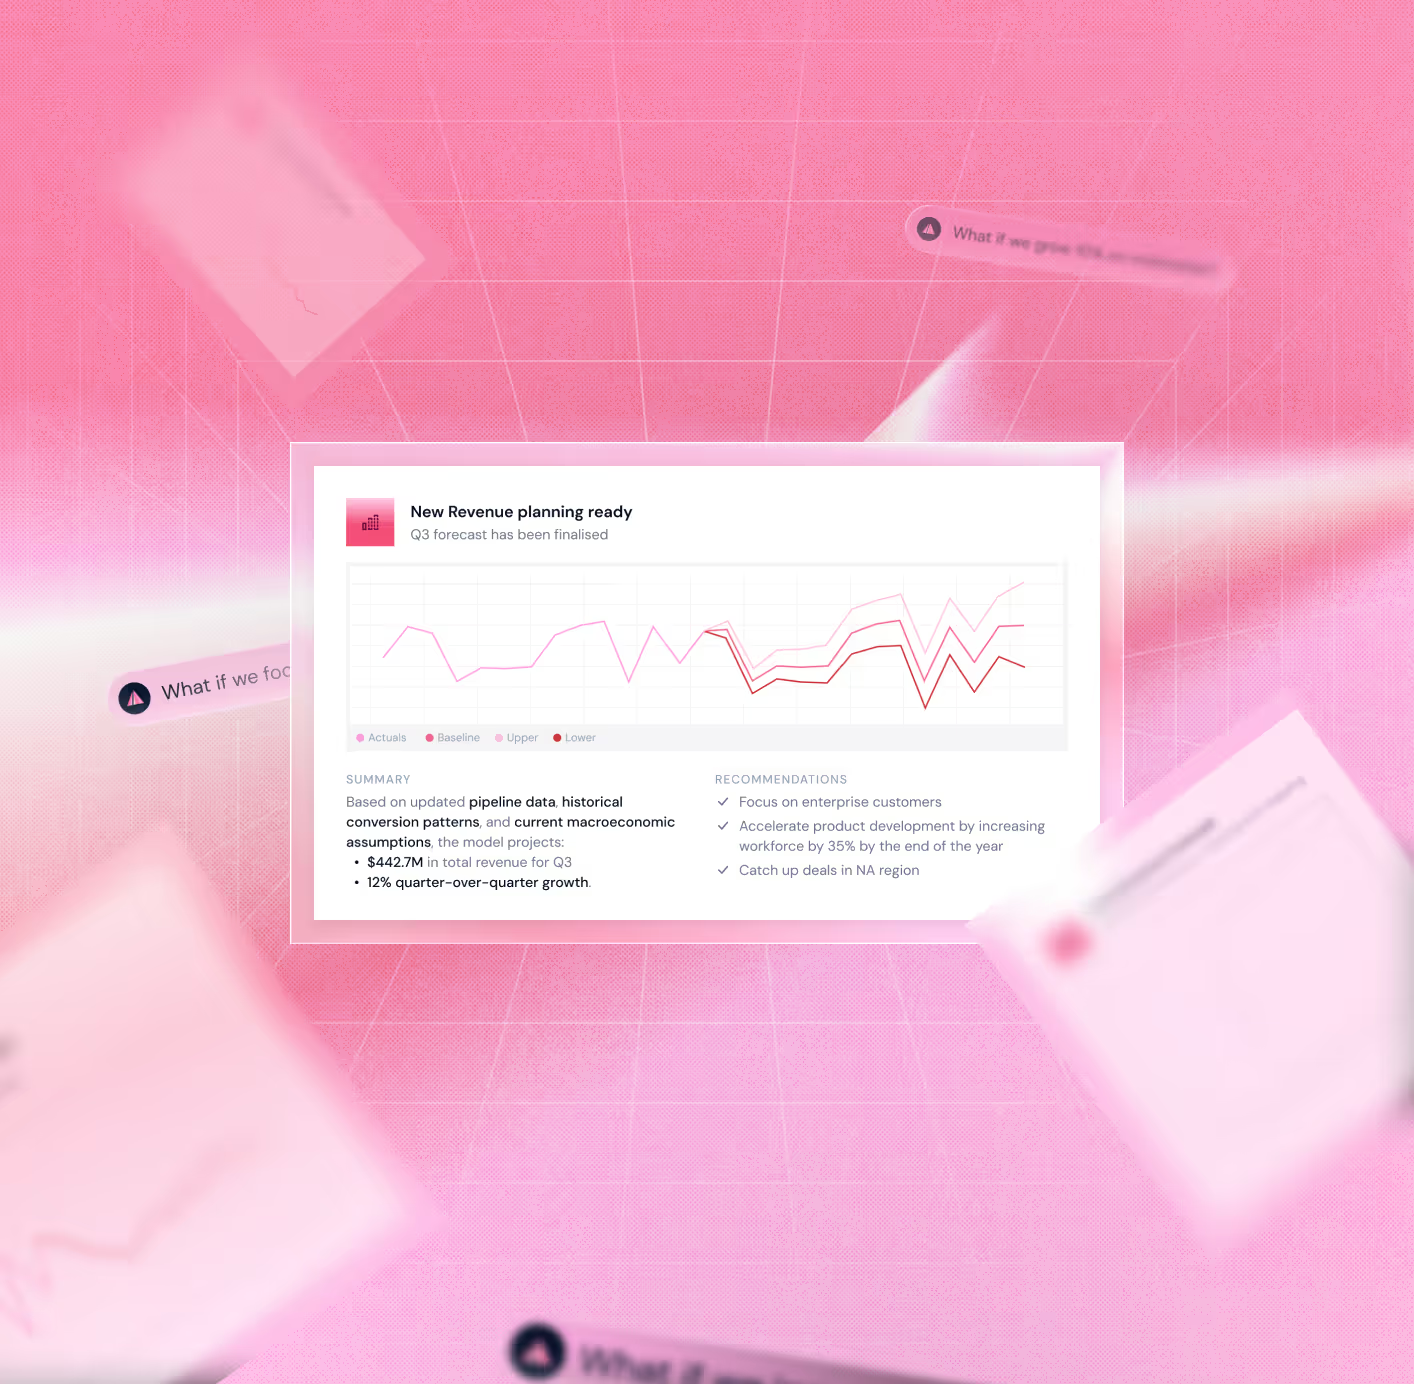
Simulates endless scenarios and provides actionable recommendations.
Data Analysis
Storytelling
Continuous Monitoring
Dashboard screen displaying a Q3 revenue forecast graph with actuals, baseline, and projected upper and lower trends, summary of pipeline data, historical conversion patterns, and macroeconomic assumptions, plus recommendations for focusing on enterprise customers, accelerating product development, and catching up deals in NA region.
Abstract orange crescent shape in front of a circular orange form on a dark blue circular background.

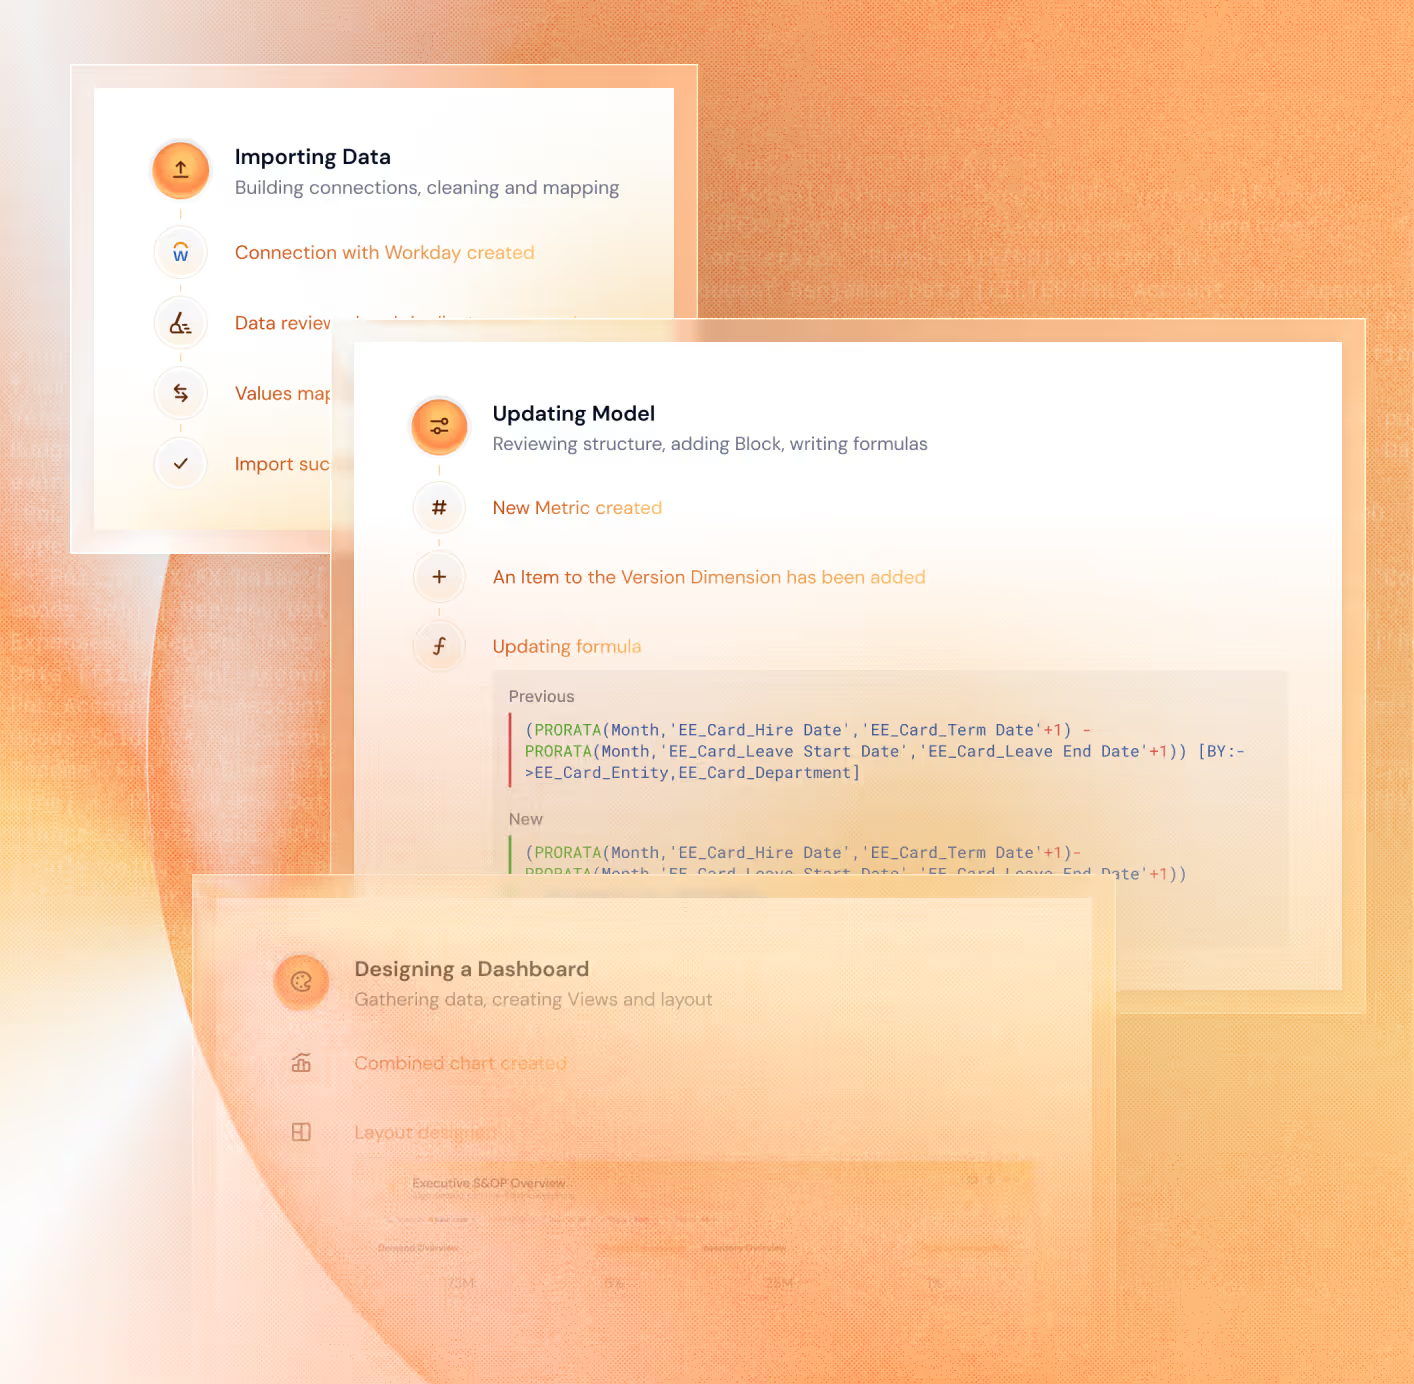
The Modeler

Handles data cleaning, mapping, transformations, and formula generation to build and optimize models.

Modeling
Workflows
Optimization
Three overlapping panels showing steps for Importing Data, Updating Model with formulas, and Designing a Dashboard on an orange background.

What our customers say

“Tariffs are the single biggest area of focus for Evenflo [...], we're constantly modeling scenarios to determine how much cost we can absorb. [...] In a fast-changing environment like this, having a tool that lets us rapidly model the P&L impact and pivot our strategy is absolutely essential.”

Kate Dolph

Senior Director FP&A and Business Planning, Evenflo

“The biggest thing for us was to be able to look at the business in all the different ways that we want too. And at the same time, forecast our P&L in a way that makes sense.”

Janelle Waters

Director, Strategic Finance, Carta

“What Pigment allows you to do is lift the rug on your current process and say, is this the best way to do it? And then will enable you to make the best decisions and create a new process that fits your updated technology stack.”

Jeremy Stern

Finance Manager, ClickUp

“With Pigment, we’re finally able to bring together our Finance and Procurement teams in one single platform, connect our models in real time, and share reliable data with our different managers.”

Cécile Creusot

Financial Controlling Director, IDKIDS

"With Pigment, we know that we're able to adapt the tool to our needs rather than having to structure our planning processes around the tool."

Nicole Wittlin

VP Strategic Finance, Figma

Request a Demo

Speak with our experts to find out how Pigment can help you improve decision-making.

Chima, Ravi HeadshotSygrove, Colin, HeadshotMejia, Amelia HeadshotMerritt, Justin Headshot - Web Size Small
Trusted by industry-leading companies